Agency command centre
Your operating view
Review portfolio performance, account health, engagements and billing from one place. Follow the figures into the account and the work behind them.
Vela · Operating platform
AI costs sit in billing systems while business outcomes sit in spreadsheets. Vela puts engagement delivery, operating cost and measured value in one view for your team and your clients. The public demonstration uses sample data; a conversation maps it to your organisation.
The public demonstration · sample data
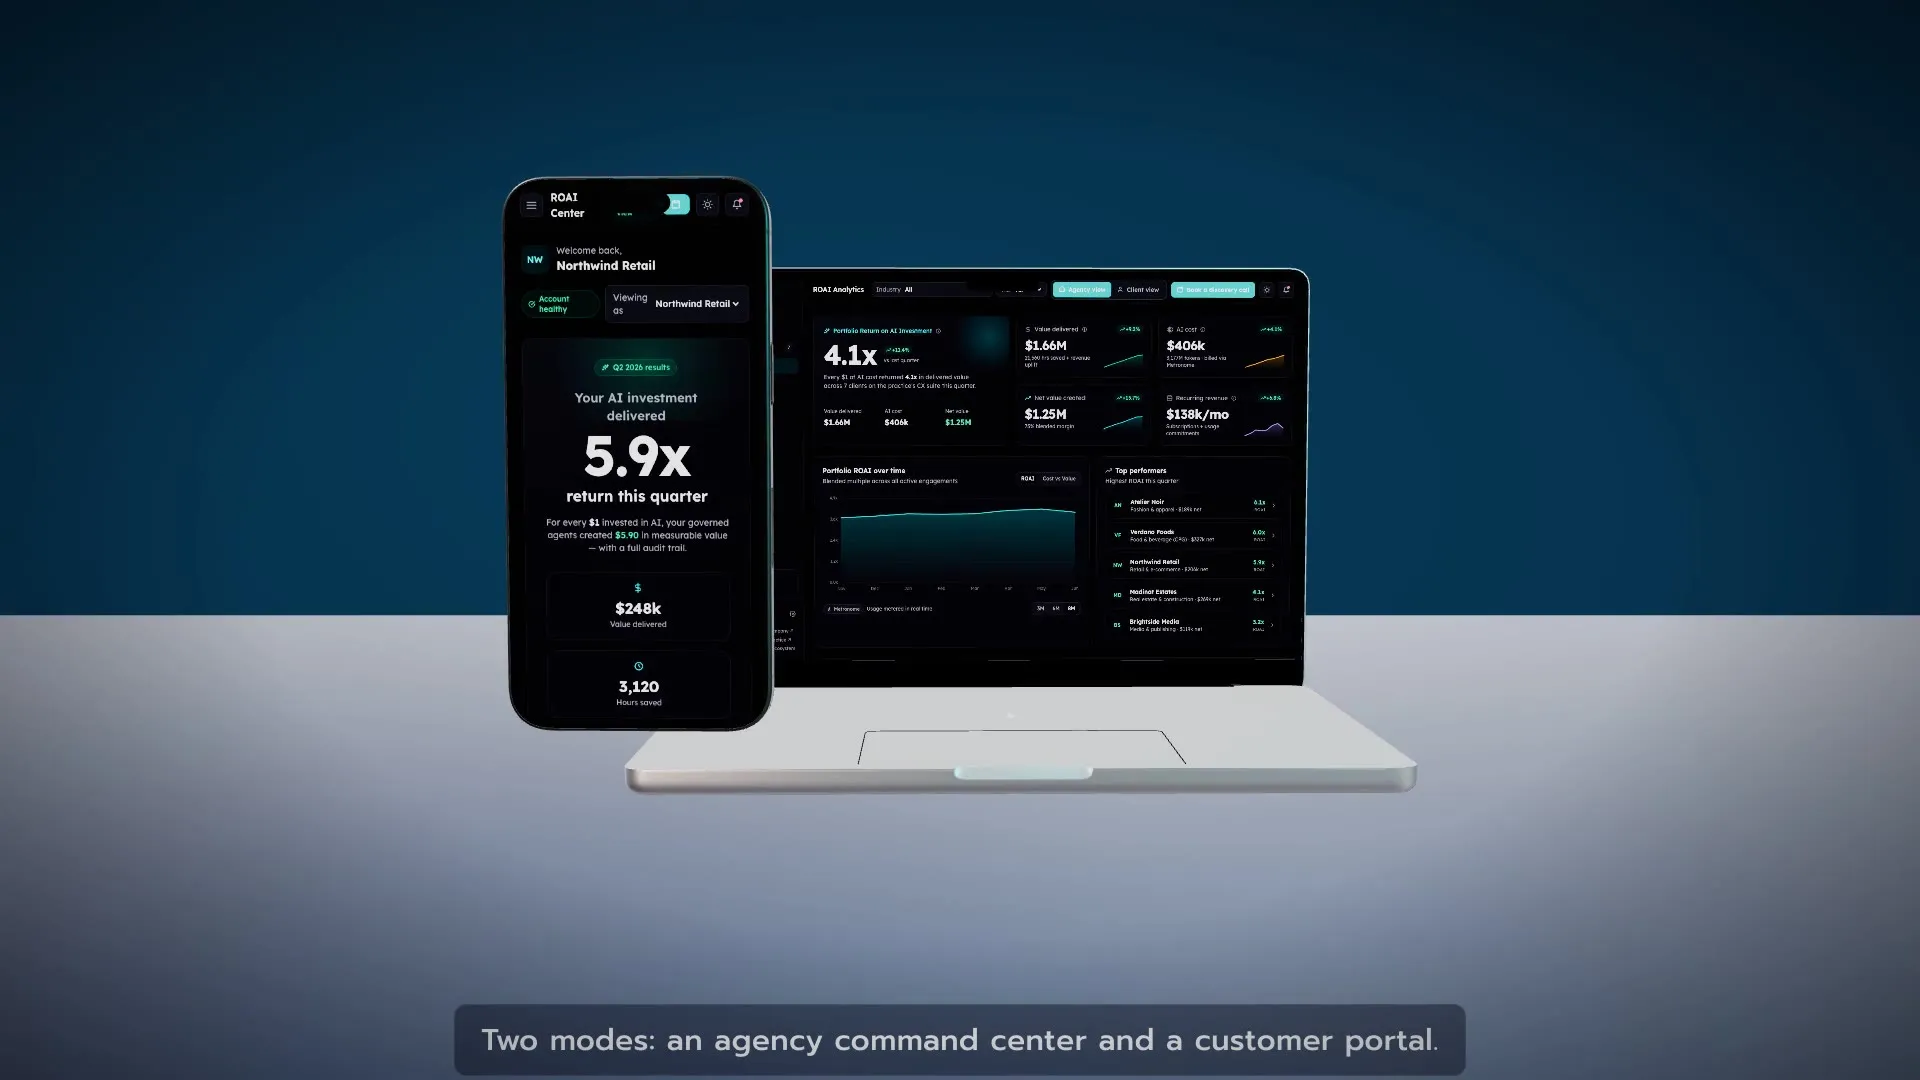
Two perspectives
One engagement. Two views of the same records: the team that runs the work, and the client who sponsors it.
Your operating view
Review portfolio performance, account health, engagements and billing from one place. Follow the figures into the account and the work behind them.
The same engagement, their side
Explore active work, measured value, product options, usage and billing from a client perspective. Actual workspace access is provided for the agreed engagement.
The stall
AI costs sit in billing systems while business outcomes sit in spreadsheets. Connecting the two becomes a reporting project of its own.
Delivery teams and sponsors need a shared view of what is running, what it costs and whether it is improving the business.
Sponsors need the engagement from their side: work, value, usage and billing, with access boundaries you can explain.
Sixty-six seconds
How the operating view keeps AI cost, delivery and business value in one place. Click to play; the file is not fetched until then.
In the demonstration
Engagement, AI cost, attributed value and the method sit in one operating view. Use the labelled diagram to discuss the calculation your organisation would need.
The public application is an interactive demonstration. Client names and portfolio figures are sample data; the live billing panel uses a Metronome sandbox. They demonstrate the experience and integration pattern, not delivered client results.
Ledger from engagement and AI cost through attributed value to a visible return, labelled as a sample.
Live demonstration
Agency and client views on sample data. Billing objects in the live panel come from a Metronome sandbox.
The Vela line
Explore the product line through the public interface. API editions are available through Agent Commerce, where each service describes its output and payment requirements.
A content rewrite, machine-readable site summary and structured-data output built from the information supplied.
An answer grounded in supplied context, with claims requiring verification made visible for review.
A catalogue ranked using embedding similarity, with the scores available to inspect.
Product-feed validation and structured data that reflects the fields that passed the checks.
A URL scan covering machine access and relevant discovery signals at the time of the request.
Return on AI investment
Start with an agreed definition of value. Where time savings are included, state how they are valued; keep attributed revenue and estimated benefits distinct.
ROAI = (Value − AI cost) ÷ AI cost
In this example, total value is 4.0× cost and net ROAI is 3.0×. This explains the formula; it is not a client result.
From demonstration to deployment
Your data, access requirements and operating measures shape the implementation. Select platforms and cloud services for the workflow you need to improve.
Agree the business outcome, the value measure and the evidence needed to support it.
Map data sources, permissions, integration boundaries and billing requirements.
Configure a bounded first workflow, test the operating view and train its owners.
Review cost and value together, then expand based on the evidence.
Sample-data tour
The guide names every sample figure and sandbox object so a demonstration does not get mistaken for a result.
Questions
No. The public application is an interactive demonstration. Client names and portfolio figures are sample data; the live billing panel uses a Metronome sandbox. They show the experience and integration pattern, not delivered client results.
ROAI = (Value − AI cost) ÷ AI cost. Start with an agreed definition of value. Where time savings are included, state how they are valued; keep attributed revenue and estimated benefits distinct. The figures on this page explain the formula; they are not a client result.
The operating view is the shared account of delivery, cost and value. The product line — Vela AEO, Assist, Recs, Commerce and Scan — is what you can explore in the demonstration and, where agreed, offer as API editions through Agent Commerce.
No. An engagement starts by agreeing the outcome and the evidence, then mapping the data sources, permissions, integration boundaries and billing you already have. The first workflow is bounded and reviewable.
Open the demonstration, follow the labelled sample-data tour, then book a conversation. Bring a business problem and the systems around it. We will map a useful first delivery and the evidence that would make it worth expanding.
Vela brings AI costs, delivery and business value into one operating view. The film uses existing product artwork with sample data; figures are illustrative.
This silent film has no spoken dialogue.
On-screen text:
Your next move
Bring a business problem and the systems around it. We will map a useful first delivery and the evidence that would make it worth expanding.
Calendar not loading? Book on Cal.com or send an enquiry.